|
fragment length
|
The fragment length denotes the length of each 'fragment' that is generated from the given set of sequences.
The fragments basically represent 'DNA windows' of one sequence that are considered for individual annotation; these 'windows' are overlaping.
The fragment length should not exceed the length of the shortest DNA sequence. If fragment length is choosen too high short sequences might not be annotated at all or be reduced to single 'dots'
|
|
overlap length
|
The overlap length denotes the overlap of each fragment to its successor respectively its predecessor.
For generating a coherent line plot of given sequences it is essential to have each fragment of the sequence that is being observer respectively annotated to have a sufficient overlap to the fragments surrounding it.
|
|
k-mere length
|
k-mere length denotes the length of the polymere fragments used for generating the annotation
vector from all 'diced' fragments.
The sum of all polymeres of length k are generated dynamically, reverse complements are being s
ubsumed (eg. tttt -project-> aaaa), resulting in a reduced vector size
(eg. k=4, (a,t,c,g)^4 = 256 --reduce--> 136).
|
Viewer
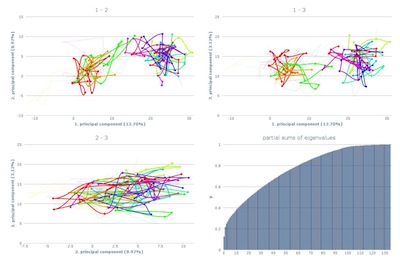
The overview shows all three pca-plots and the eigenvalue
plot. The axes are labled with the corresponding principal
component and the amount of variance it is representing.
By clicking one specific plot, a more detailed view is shown.
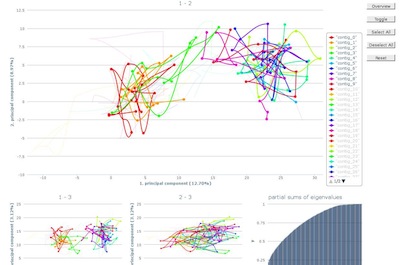
After loading, the first ten contigs will be selected.
Additional contigs can be highlighted by either selecting
the line in the graph directly or using the corresponding
legend item. Analog, contigs can be deselected and they will
fade into the background.
-
Overview
Switchs back to the overview page.
-
toogle
Hides current selection in the graph for better overview.
The selected contigs will stay visible in the legend.
dditional contigs can be selected, another toggle
merges the old selection with the new selected
contigs.
-
select all
Select all contigs.
-
deselect all
deselect all contigs
-
reset
Highlights the first ten contigs, therefore the inital
selection is restored.
All selections will simultaneously be visible in the other smaller
plots. Selecting one of these will change the detailed view.
Also the eigenvalue plot can be selected this way.
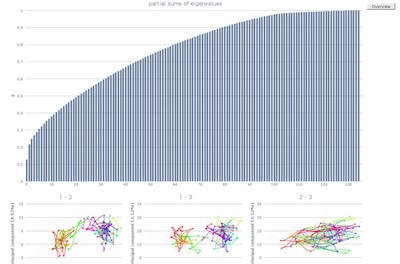
The detailed view of the partial sums of eigenvalues allows to
evaluate the variance of the underlying data.
